Dashboard
Everything you need to know, in one screen. The dashboard is your home after login — a single page that answers three questions: what needs attention, how am I tracking, and what am I working on.
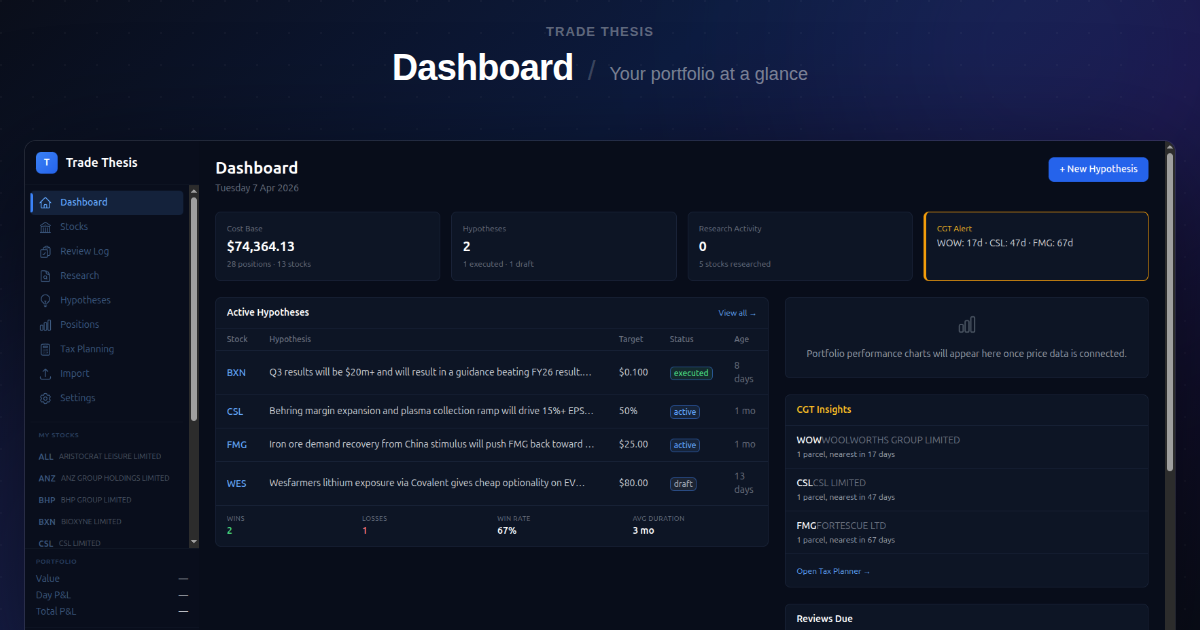
Four stat cards across the top give you the snapshot: portfolio cost base, active hypothesis count, research activity this week, and a CGT alert that lights up amber when parcels are approaching the 12-month discount threshold.
Below that, your active hypotheses table shows what you're working on — sorted by urgency (executed first, then active, then draft) with target prices and age tracking. If you've closed hypotheses, a stats strip shows your win/loss record and average hold duration.
The right column surfaces actionable insights: which stocks have parcels nearing CGT discount eligibility (with a link straight to the tax planner), and which stocks are overdue for re-review. No duplicate tools — just the information you need and links to the pages where you act on it.